 动态路由渲染指定页面
使用到的组件:

1、主页代码:
<template>
    <div :class="classObj" class="app-wrapper">
        <div v-if="device==='mobile'&&sidebar.opened" class="drawer-bg" @click="handleClickOutside" />
        <sidebar class="sidebar-container" />
        <div :class="{hasTagsView:needTagsView}" class="main-container">
            <div :class="{'fixed-header':fixedHeader}">
                <navbar />
                <tags-view v-if="needTagsView" />
            </div>
            <app-main />
        </div>
    </div>
</template>
1.1、<app-main> 所有页面渲染入口
<template>
  <section class="app-main">
    <transition name="fade-transform" mode="out-in">
      <keep-alive :include="cachedViews">
        <router-view :key="key" />
      </keep-alive>
    </transition>
  </section>
</template>
:key="key" 指定渲染的页面组件名称
<script>
export default {
  name: 'AppMain',
  computed: {
    cachedViews() {
      console.log("cachedViews: ", this.$store.state.tagsView.cachedViews)
      return this.$store.state.tagsView.cachedViews
    },
    key() {
      console.log("key: ", this.$route.path)
      return this.$route.path
    }
  }
}
</script>
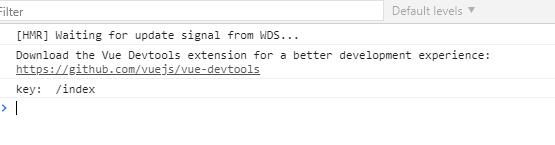
key为路由地址/index,查看router路由定义:
{
  path: '',
  component: Layout,
  redirect: 'index',
  children: [
    {
      path: 'index',
      component: () => import('@/views/index'),
      name: '首页',
      meta: { title: '首页', icon: 'dashboard', noCache: true, affix: true }
    }
  ]
}
将渲染@/views/index页面
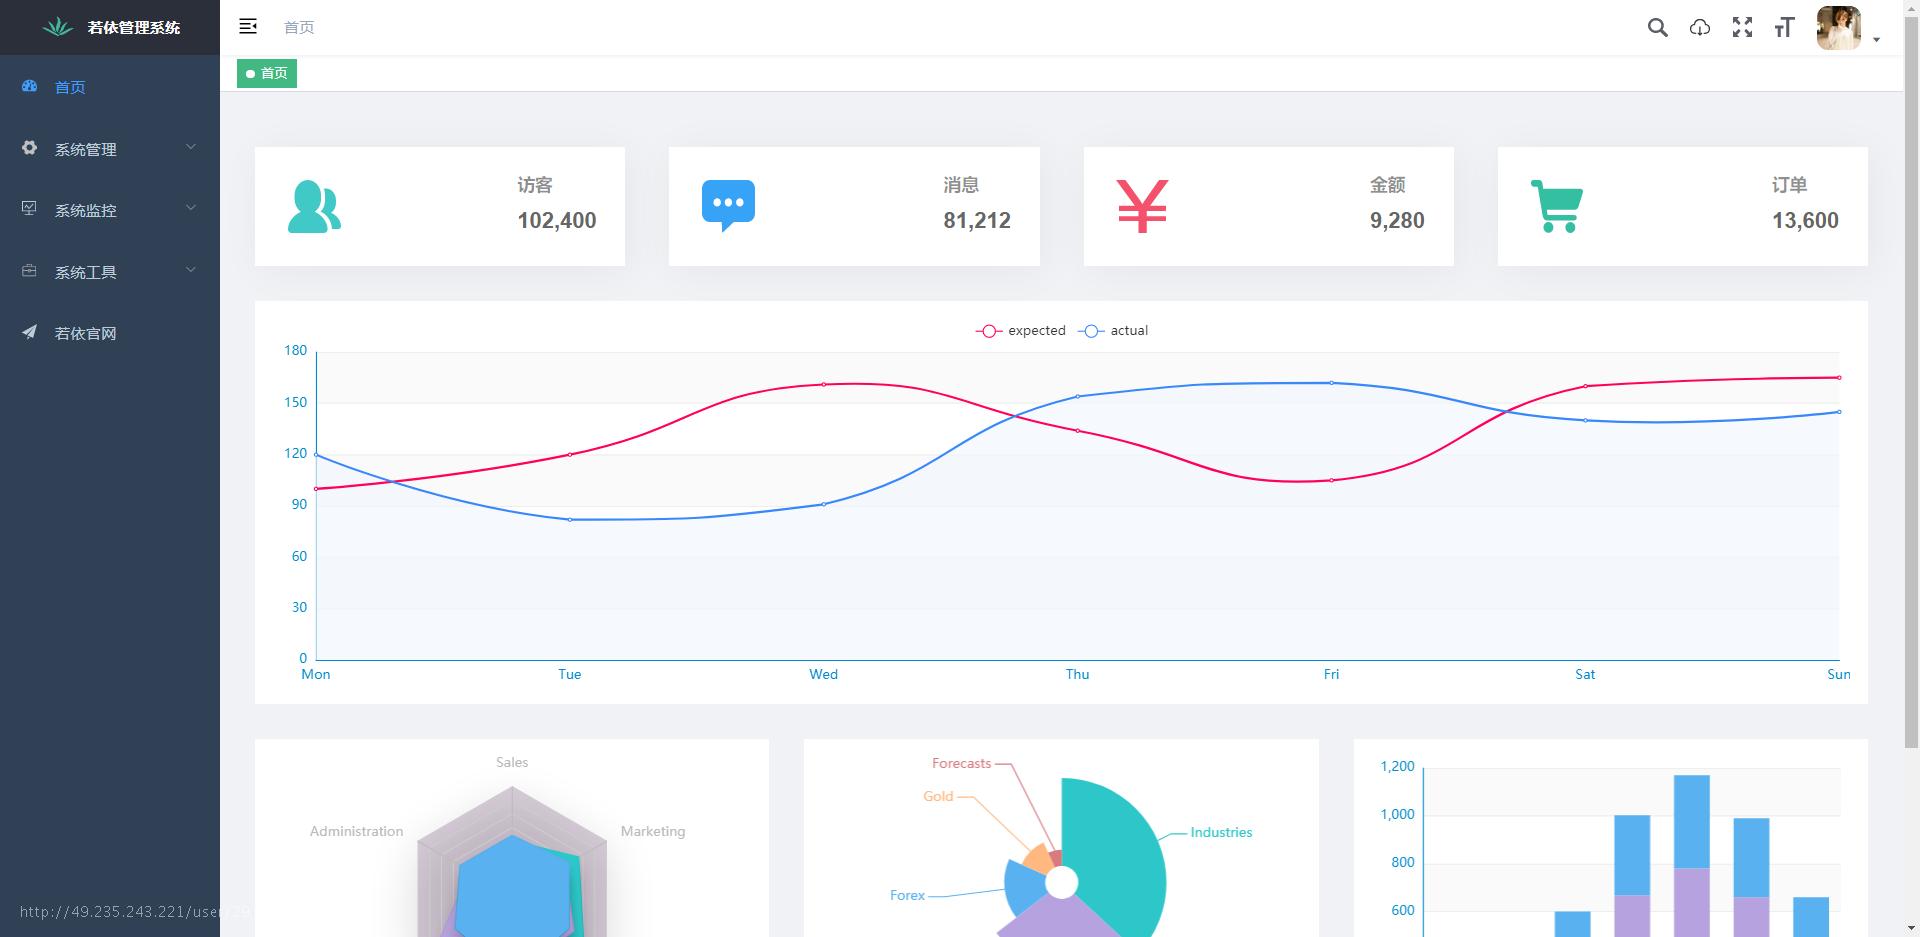
2、首页页面渲染
<template>
  <div class="dashboard-editor-container">

    <panel-group @handleSetLineChartData="handleSetLineChartData" />

    <el-row style="background:#fff;padding:16px 16px 0;margin-bottom:32px;">
      <line-chart :chart-data="lineChartData" />
    </el-row>

    <el-row :gutter="32">
      <el-col :xs="24" :sm="24" :lg="8">
        <div class="chart-wrapper">
          <raddar-chart />
        </div>
      </el-col>
      <el-col :xs="24" :sm="24" :lg="8">
        <div class="chart-wrapper">
          <pie-chart />
        </div>
      </el-col>
      <el-col :xs="24" :sm="24" :lg="8">
        <div class="chart-wrapper">
          <bar-chart />
        </div>
      </el-col>
    </el-row>


  </div>
</template>

<script>
import PanelGroup from './dashboard/PanelGroup'
import LineChart from './dashboard/LineChart'
import RaddarChart from './dashboard/RaddarChart'
import PieChart from './dashboard/PieChart'
import BarChart from './dashboard/BarChart'

const lineChartData = {
  newVisitis: {
    expectedData: [100, 120, 161, 134, 105, 160, 165],
    actualData: [120, 82, 91, 154, 162, 140, 145]
  },
  messages: {
    expectedData: [200, 192, 120, 144, 160, 130, 140],
    actualData: [180, 160, 151, 106, 145, 150, 130]
  },
  purchases: {
    expectedData: [80, 100, 121, 104, 105, 90, 100],
    actualData: [120, 90, 100, 138, 142, 130, 130]
  },
  shoppings: {
    expectedData: [130, 140, 141, 142, 145, 150, 160],
    actualData: [120, 82, 91, 154, 162, 140, 130]
  }
}

export default {
  name: 'Index',
  components: {
    PanelGroup,
    LineChart,
    RaddarChart,
    PieChart,
    BarChart
  },
  data() {
    return {
      lineChartData: lineChartData.newVisitis
    }
  },
  methods: {
    handleSetLineChartData(type) {
      this.lineChartData = lineChartData[type]
    }
  }
}
</script>

<style lang="scss" scoped>
.dashboard-editor-container {
  padding: 32px;
  background-color: rgb(240, 242, 245);
  position: relative;

  .chart-wrapper {
    background: #fff;
    padding: 16px 16px 0;
    margin-bottom: 32px;
  }
}

@media (max-width:1024px) {
  .chart-wrapper {
    padding: 8px;
  }
}
</style>
首页表单渲染:
 恭喜注册成功,快来登录吧!